In math class today and tomorrow, students will use some of the statistics they've learned (mean, median, box plots, distribution) to look at how wealth could be distributed in a country, how each person thinks wealth should be distributed, and how wealth actually is distributed in the United States.
To consider these questions, we're using a lesson called Wealth of Nations from a company called Mathalicious. One thing I really like about Mathalicious lessons is that they guide students to look at the world through the lens of mathematics, but they trust students to think for themselves and draw their own conclusions. So we'll look at the actual distribution of wealth in our country, as well as what people tend to think it is, but different students can have very different opinions about whether this distribution is a problem or not.
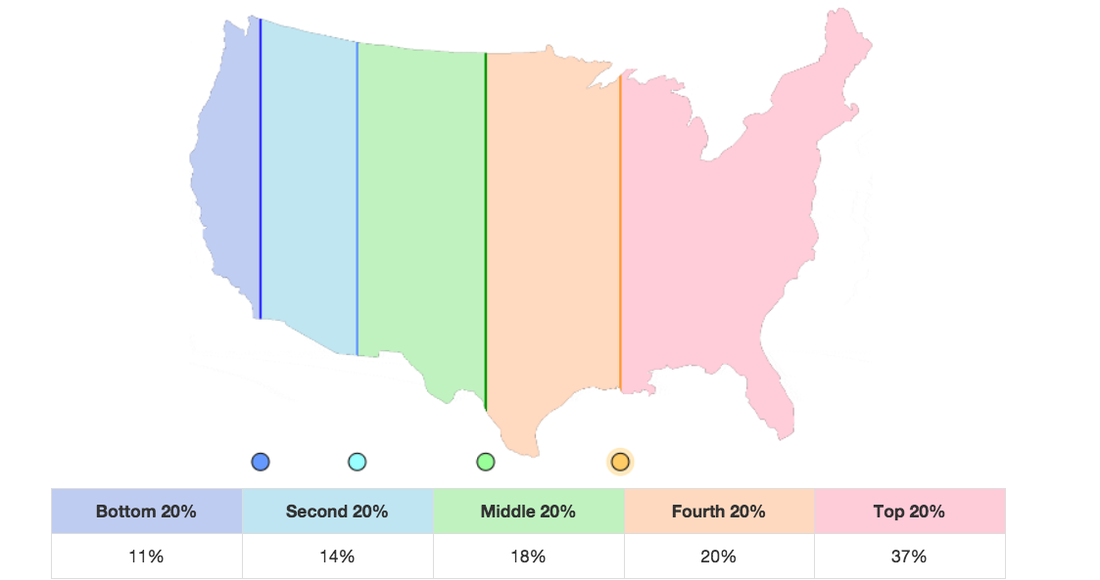
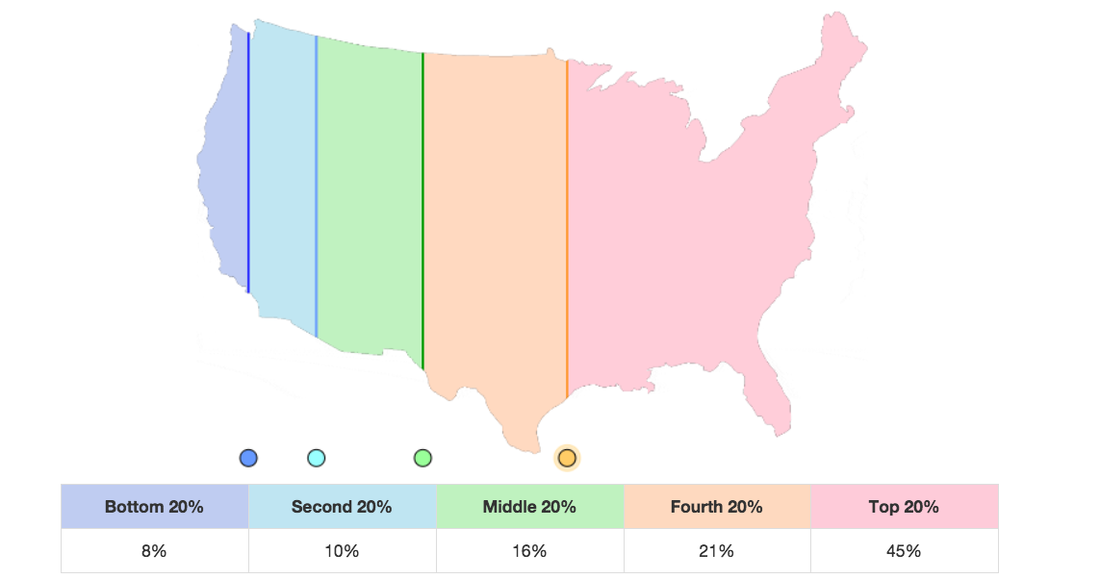
As a starting point, each class came up with a sort of consensus description of what they think is the distribution of wealth in the US. In each picture below, the United States graphic is only important in showing the width of each section, which is proportional to the share of the wealth each group has. The percentage of total wealth each group owns is described in the table, too. The "bottom 20%," "top 20%," etc. each refer to 20% (1/5) of the population: that is, "bottom 20%" and "top 20%" have the same number of people, but the people in the bottom have the least personal wealth and the people in the top have the most.
Here's what each period came up with on Day 1.
Period 1:
To consider these questions, we're using a lesson called Wealth of Nations from a company called Mathalicious. One thing I really like about Mathalicious lessons is that they guide students to look at the world through the lens of mathematics, but they trust students to think for themselves and draw their own conclusions. So we'll look at the actual distribution of wealth in our country, as well as what people tend to think it is, but different students can have very different opinions about whether this distribution is a problem or not.
As a starting point, each class came up with a sort of consensus description of what they think is the distribution of wealth in the US. In each picture below, the United States graphic is only important in showing the width of each section, which is proportional to the share of the wealth each group has. The percentage of total wealth each group owns is described in the table, too. The "bottom 20%," "top 20%," etc. each refer to 20% (1/5) of the population: that is, "bottom 20%" and "top 20%" have the same number of people, but the people in the bottom have the least personal wealth and the people in the top have the most.
Here's what each period came up with on Day 1.
Period 1:
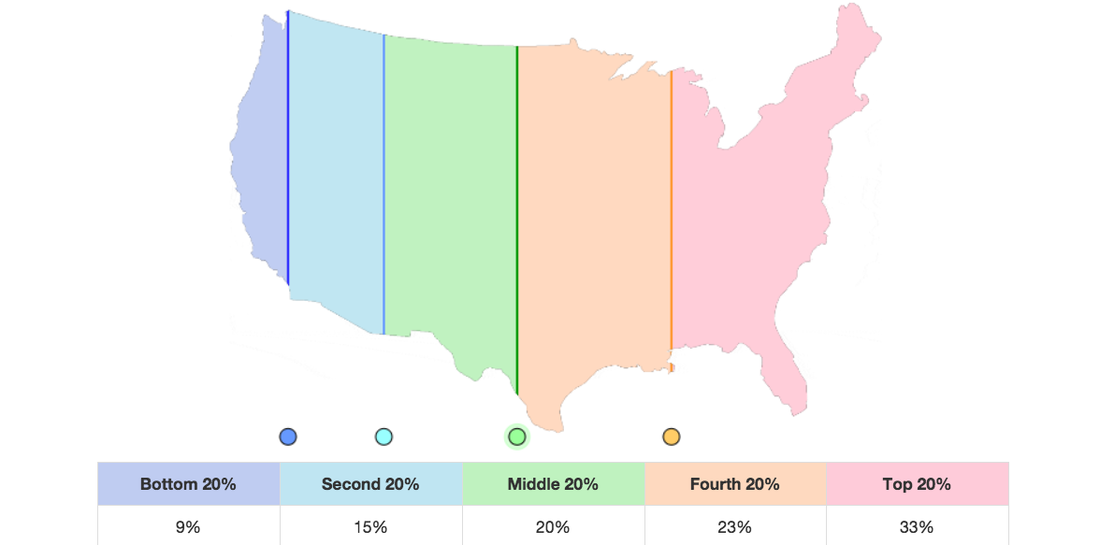
Period 3:
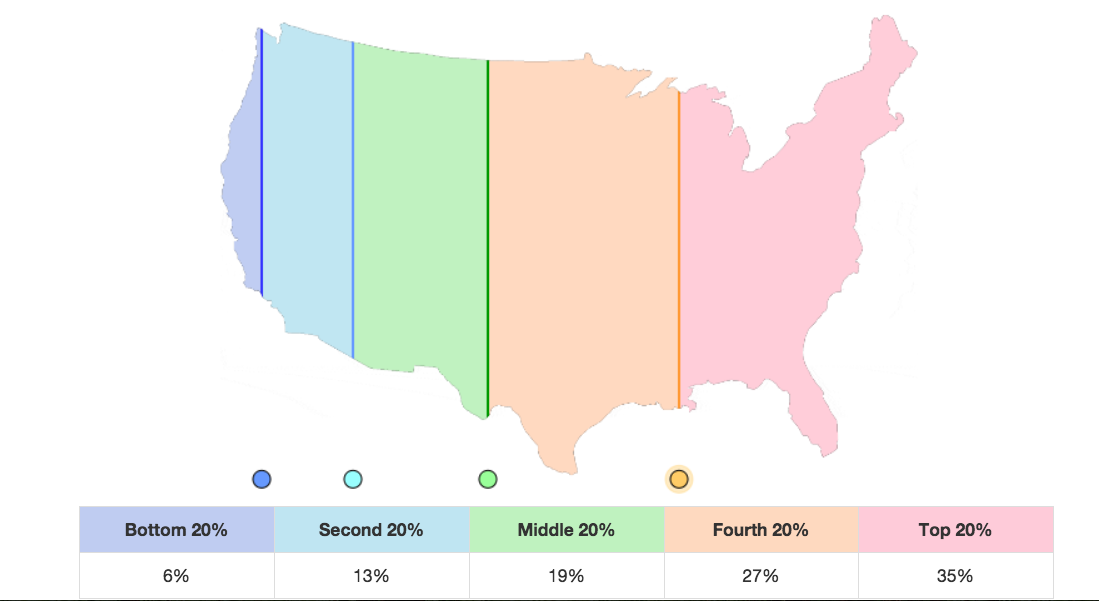
Period 4:
Period 5:
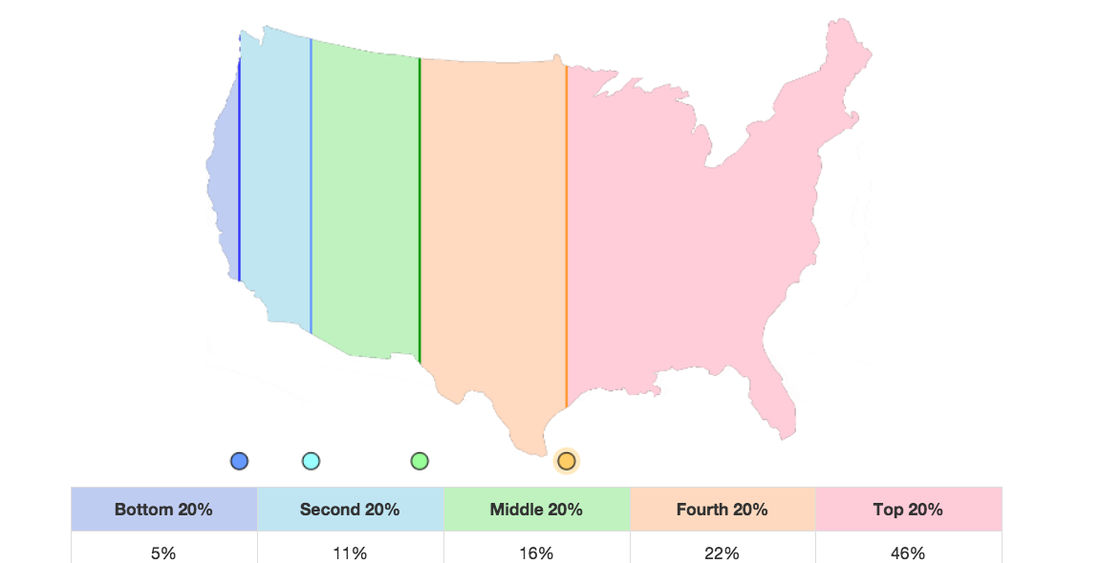
Period 6:
What's the reality? Stay tuned!
 RSS Feed
